


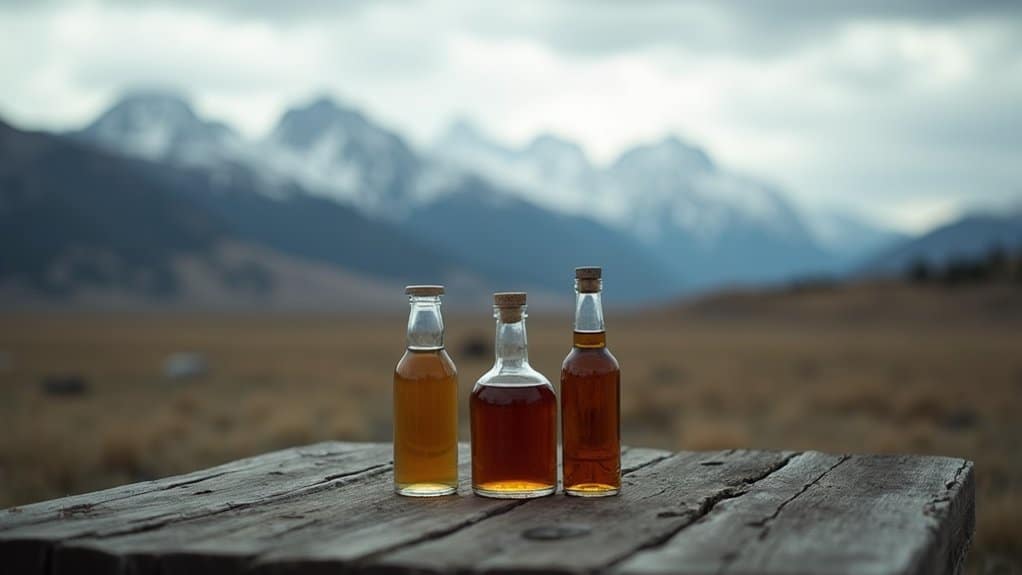
Montana ranks as the state with the highest rate of alcoholism in 2025, with 21.8% of adults drinking excessively and 46% of driving fatalities involving alcohol, the nation’s highest percentage. However, you’ll see different states topping lists depending on the metric used. North Dakota leads in binge drinking at 24.7%, while New Mexico has the highest alcohol-related death rate at 34.3 per 100,000 people. Understanding why these rankings shift reveals critical patterns in regional drinking behaviors.
Montana Ranks First for Alcoholism in 2025
When it comes to alcohol misuse in the United States, Montana consistently ranks at or near the top of nearly every measurable category. You’ll find that 19.5% of Montana adults report binge drinking monthly, compared to just 15.2% nationally. The state’s alcohol-attributable death rate exceeds 60 per 100,000 residents, far surpassing the national average of 42 per 100,000.
High risk demographics include teenagers and young adults. Montana high school students report binge drinking at 13.4%, versus 8.8% nationally. Over one-fifth of college students admitted to driving under the influence within three months. Nationally, alcohol is responsible for 25.4% of deaths among 20- to 34-year-olds, making young adult intervention particularly critical.
These statistics demand attention from regional prevention programs. Between 2019 and 2023, Montana recorded 2,941 alcohol-related deaths, nearly double the previous five-year period. You’re looking at a public health crisis requiring immediate, targeted intervention. The state also faces nearly 4,000 impaired driving arrests annually, reflecting how alcohol abuse extends beyond individual health consequences to threaten public safety on Montana roads. Montana’s drinking culture runs so deep that the state only passed stricter open container laws in 2005 to address its long history of relaxed attitudes toward drinking and driving.
The Top Five States With the Highest Alcoholism Rates
Although Montana‘s statistics paint a troubling picture, it doesn’t actually hold the top position when you examine detailed state rankings. North Dakota leads with 24.7% of adults drinking excessively and a composite score of 90.6. Wisconsin follows closely at 24.5%, recording the highest daily death rate from excessive alcohol at 7.3 deaths per day.
Alaska ranks third with 22.1% excessive drinking rates, while Montana places fourth at 21.8%. Illinois rounds out the top five at 21.2%. These states share concerning alcohol-impaired driving rates ranging from 33.8% to 36.9%. This is particularly alarming given that close to one-third of all driving fatalities nationwide are attributed to alcohol-impaired driving. Montana remains especially dangerous on the roads, with 46% of driving fatalities involving alcohol, the highest percentage in the nation. The financial impact is equally staggering, as Alaskans spent the most on alcohol annually at $1,250 per adult, while Montana residents increased their spending by 4.17% year-over-year.
Understanding these rankings helps you recognize where public health strategies need strengthening. The policy implications are significant, targeted interventions in these high-risk populations could reduce preventable deaths and address the systemic factors driving excessive consumption across these communities.
Why Different Metrics Show Different Rankings
You’ll notice that state rankings shift dramatically depending on whether researchers measure per capita consumption, alcohol-related spending patterns, or death rates from liver disease and other causes. The way surveys define excessive drinking, using QF methods that undercount heavy occasions versus GF approaches that capture binge patterns, directly shapes which states appear most affected. Understanding these metric differences helps you interpret why one study might rank a state in the top five while another places it in the middle of the pack. Additionally, 12-month reference periods capture infrequent but heavy drinkers that shorter 30-day measures often miss entirely, which can significantly alter prevalence estimates across states. Research shows that contextual survey methods capturing drinking location, partners, and occasion type report higher total alcohol consumption in approximately 50% of drinkers compared to standard beverage-specific approaches. Comparing consumption data becomes even more complex because different alcoholic beverages contain varying amounts of alcohol, making standard drink measurements essential for accurate cross-state comparisons of actual alcohol intake.
Consumption Versus Spending Data
The state that ranks highest for alcoholism depends entirely on which metric you examine. When you analyze consumption data, New Hampshire leads at 3.15 gallons per capita, while binge drinking rates place North Dakota first at 24.7%. Spending data tells another story, Alaska tops that list at $1,250 annually per adult.
Your data interpretation must account for demographic variations across regions. Midwest states consistently rank high for binge drinking frequency, reflecting cultural drinking patterns rather than total volume consumed. Meanwhile, Western states dominate spending rankings due to higher living costs and income levels. National data shows promising trends, with the lowest rate in 5 years at 16.4% for excessive alcohol consumption recorded in 2023.
You’ll notice consumption volume doesn’t correlate directly with spending. Utah reports the lowest spending ($607) despite measurable consumption, while Alaska’s inflated costs skew per-capita figures upward without necessarily indicating higher alcoholism prevalence. Regional analysis reveals the Northeast experienced the largest consumption increase at 5.4% growth, suggesting geographic patterns matter significantly when interpreting state-level alcoholism data.
Death Rates Vary Widely
When examining death rates tied to alcohol, New Mexico emerges as the clear leader with 34.3 deaths per 100,000 people, nearly six times higher than Hawaii‘s 5.9 rate. Western states dominate these rankings, with 30 states reaching double-digit rates by 2019 compared to just 10 in 2006. These statistics reflect age-adjusted rates calculated using ICD-10 cause-of-death codes defined as alcohol-induced by the CDC.
However, alcohol fatality patterns shift dramatically when you examine specific metrics. Alaska leads poisoning deaths at 46.5 per million, while North Dakota tops alcohol-related driving deaths at 46.7%. Rural states show heightened driving fatalities, reflecting socioeconomic considerations like limited transportation options and longer emergency response times. This aligns with national trends showing alcohol-related deaths have increased more in non-metropolitan areas than in any other level of urbanization since 2006.
You’ll find the national average sits at 10.4 deaths per 100,000, matching Indiana’s rate exactly. Utah maintains the lowest overall death rate, correlating directly with its low heavy drinking prevalence. Nationally, age-standardized death rates from excessive alcohol use increased approximately 25% from 38.1 to 47.6 per 100,000 population between 2016-2017 and 2020-2021.
Defining Excessive Drinking Matters
Because researchers measure alcohol consumption through vastly different lenses, state rankings shift dramatically depending on which metric you examine. The CDC defines binge drinking as 4+ drinks for women or 5+ for men per occasion, while heavy drinking requires 8+ weekly for women or 15+ for men. These thresholds capture different populations entirely.
Your comparison between different drinking measures reveals stark contrasts. Per capita metrics include abstainers, diluting consumption averages, while drinkers-only calculations show actual intake patterns, averaging 27g pure alcohol daily among those who drink. International comparisons highlight similar complexity, as Romania’s 16.8 litres per capita consumption far exceeds Greece’s 5.8 litres, yet both countries must be evaluated through their unique cultural drinking patterns.
The influences of culture and environment shape which metrics appear most alarming. States with high abstention rates may show moderate per capita consumption yet heightened binge rates among drinkers. Understanding these definitional differences helps you interpret why one state ranks first on some measures but fifth on others. Adding further context, a majority now believes moderate drinking harms health, which may influence how states report and address their consumption statistics.
How Death Rates and Spending Shift the Results

How dramatically do death rates reshape state rankings when you move beyond simple drinking prevalence? Missouri illustrates this shift perfectly, recording 14.1 daily deaths from excessive alcohol despite mid-tier drinking rates. When you examine deaths versus drinking prevalence, you’ll find states like Nevada (8.7 daily deaths) climbing rankings while high-prevalence states like North Dakota maintain position through different metrics.
| State | Daily Deaths | Excessive Drinking Rate |
|---|---|---|
| Missouri | 14.1 | Mid-tier |
| Nevada | 8.7 | Moderate |
| New Mexico | 2.5 | 17.4% |
Consumption volume versus mortality reveals critical patterns. New Hampshire’s 4.8 gallons per capita drives impact differently than Wisconsin’s 25.2% excessive drinking rate. You’re seeing mortality data pull states upward regardless of binge drinking prevalence alone.
Why Cold-Weather States Dominate Alcoholism Data
Cold-weather states consistently dominate alcoholism rankings, and the data reveals why temperature functions as more than mere coincidence. Research across 193 countries and 3,144 U.S. counties shows negative correlation between temperature and heavy drinking (Spearman’s Rho −0.57; P < 0.001). Wisconsin, North Dakota, and Montana lead at 27%, 25%, and 24% respectively.
You’ll find shorter sunlight hours directly correlate with depression rates, which then drive alcohol consumption upward. Northern regions with extended winter darkness demonstrate this pattern clearly.
If you carry genetic vulnerability to alcohol disorders, cold-climate residence heightens your risk. Environmental triggers in these regions compound biological predisposition, leading to accentuated rates of alcoholic cirrhosis in younger populations. Geographic location represents a modifiable risk factor you can address through informed decisions about where you live.
Which States Have the Lowest Drinking Rates?
You’ll find Utah consistently at the bottom of alcohol consumption rankings, reporting just 1.34 gallons per capita and only $607 in annual spending, figures shaped largely by the state’s strict regulatory framework and cultural influences. Southern states like Mississippi, Oklahoma, and Tennessee cluster together with spending under $700 per capita, suggesting regional patterns that extend beyond individual state policies. When you examine these low-consumption states collectively, you’re seeing populations where reduced drinking behavior correlates with specific regulatory environments and cultural attitudes toward alcohol.
Utah’s Low Consumption
While many states grapple with high alcohol consumption rates, Utah stands apart with the nation’s lowest per capita alcohol spending at just $607 in 2024. You’ll find this figure reflects strong cultural influences, particularly the state’s significant Mormon population, which prohibits alcohol consumption. This translates into measurable health outcomes for residents who face reduced exposure to alcohol-related risks.
When you examine Utah’s spending patterns, you’ll notice a year-over-year decrease that contrasts with states showing modest increases. West Virginia follows closely at $617 per capita, while Mississippi records $641. These low-consumption states share similar trajectories, with minimal growth or outright declines in alcohol expenditure.
Utah’s data demonstrates how population-level cultural factors directly shape consumption patterns, creating environments where you’re statistically less likely to encounter alcohol-related harms.
Southern States Trends
Beyond Utah’s distinctive position, a cluster of Southern states demonstrates consistently low drinking rates shaped by shared cultural and regulatory factors. You’ll find West Virginia ranking second lowest at 11%, while Alabama and Arkansas tie for third at 12%. Oklahoma follows at 13%, with Mississippi and Georgia reporting 14%.
These regulatory factors include dry counties and stricter alcohol controls that limit access. Cultural influences, particularly religious traditions, contribute to higher abstention rates across the Southeast.
Spending data reinforces these patterns. West Virginia shows the nation’s lowest per capita alcohol spend at $617 in 2024. Mississippi follows at $641, Oklahoma at $691, and Tennessee at $694.
Unlike states experiencing national declines, Alabama, Arkansas, Kentucky, Louisiana, South Carolina, and West Virginia maintain stable consumption rates from peak years. Binge drinking rates remain conspicuously lower in West Virginia and Alabama.
Frequently Asked Questions
What Treatment Resources Are Available for Alcoholism in High-Ranking States?
You’ll find extensive addiction support services across high-ranking states like New Mexico and Montana. These states operate rehabilitation facilities including SAMHSA-certified inpatient programs, MAT clinics offering naltrexone, and telehealth counseling for rural populations. New Mexico’s resources target its 84.5 per 100k death rate through specialized hospital programs, while Montana and the Dakotas deploy mobile units and tribal-focused treatment. You can access free assessments, sliding-scale fees, and 28-30 day detox programs based on your risk profile.
How Does Alcoholism Affect Employment Rates in States Like Montana?
Alcoholism profoundly impacts employment rates in Montana, where you’ll find the 21.8% excessive drinking rate directly correlating with reduced job opportunities. When you examine lifestyle factors like the state’s 46% alcohol-related driving fatalities, you’re seeing workforce safety risks that increase absenteeism and underemployment. Montana’s rural demographics amplify these employment disruptions, as heavy drinking populations demonstrate lower labor force participation and decreased workplace productivity compared to states with lower consumption rates.
Are There Age Restrictions on Alcohol That Differ Between States?
Yes, you’ll find state-specific alcohol regulations vary remarkably across the U.S., though legal drinking age requirements remain consistent at 21 nationwide. However, states differ on exceptions, some permit consumption with parental supervision, for religious purposes, or on private property. When analyzing population-level drinking patterns, these regulatory variations become risk factors you should consider, as states with more permissive exceptions may show diverse consumption patterns among younger demographics.
What Prevention Programs Have Successfully Reduced Drinking Rates in Other States?
You’ll find that community-based education programs targeting high-risk populations have demonstrated measurable reductions in binge drinking rates across multiple states. Peer-to-peer counseling initiatives, particularly those implemented in college settings and rural communities, show promising outcomes when you analyze pre- and post-intervention data. However, the current research lacks detailed state-by-state comparisons of prevention program effectiveness, making it difficult to identify which specific interventions you should prioritize for implementation.
How Do Alcohol Taxes Vary Among States With High Alcoholism Rates?
You’ll find significant variation in alcohol taxes among high-alcoholism states. Montana generates substantial alcohol tax revenue allocation through state-controlled liquor stores, while Wisconsin maintains relatively low beer taxes despite high consumption rates. North Dakota and New Mexico apply moderate excise taxes. Research shows alcohol tax policy impact directly correlates with reduced drinking rates, states with higher taxes typically see lower consumption. However, these four states haven’t leveraged aggressive taxation as a primary prevention strategy.